We Analyzed 12,386 AI Room Redesigns: A 2026 Interior Design Data Study
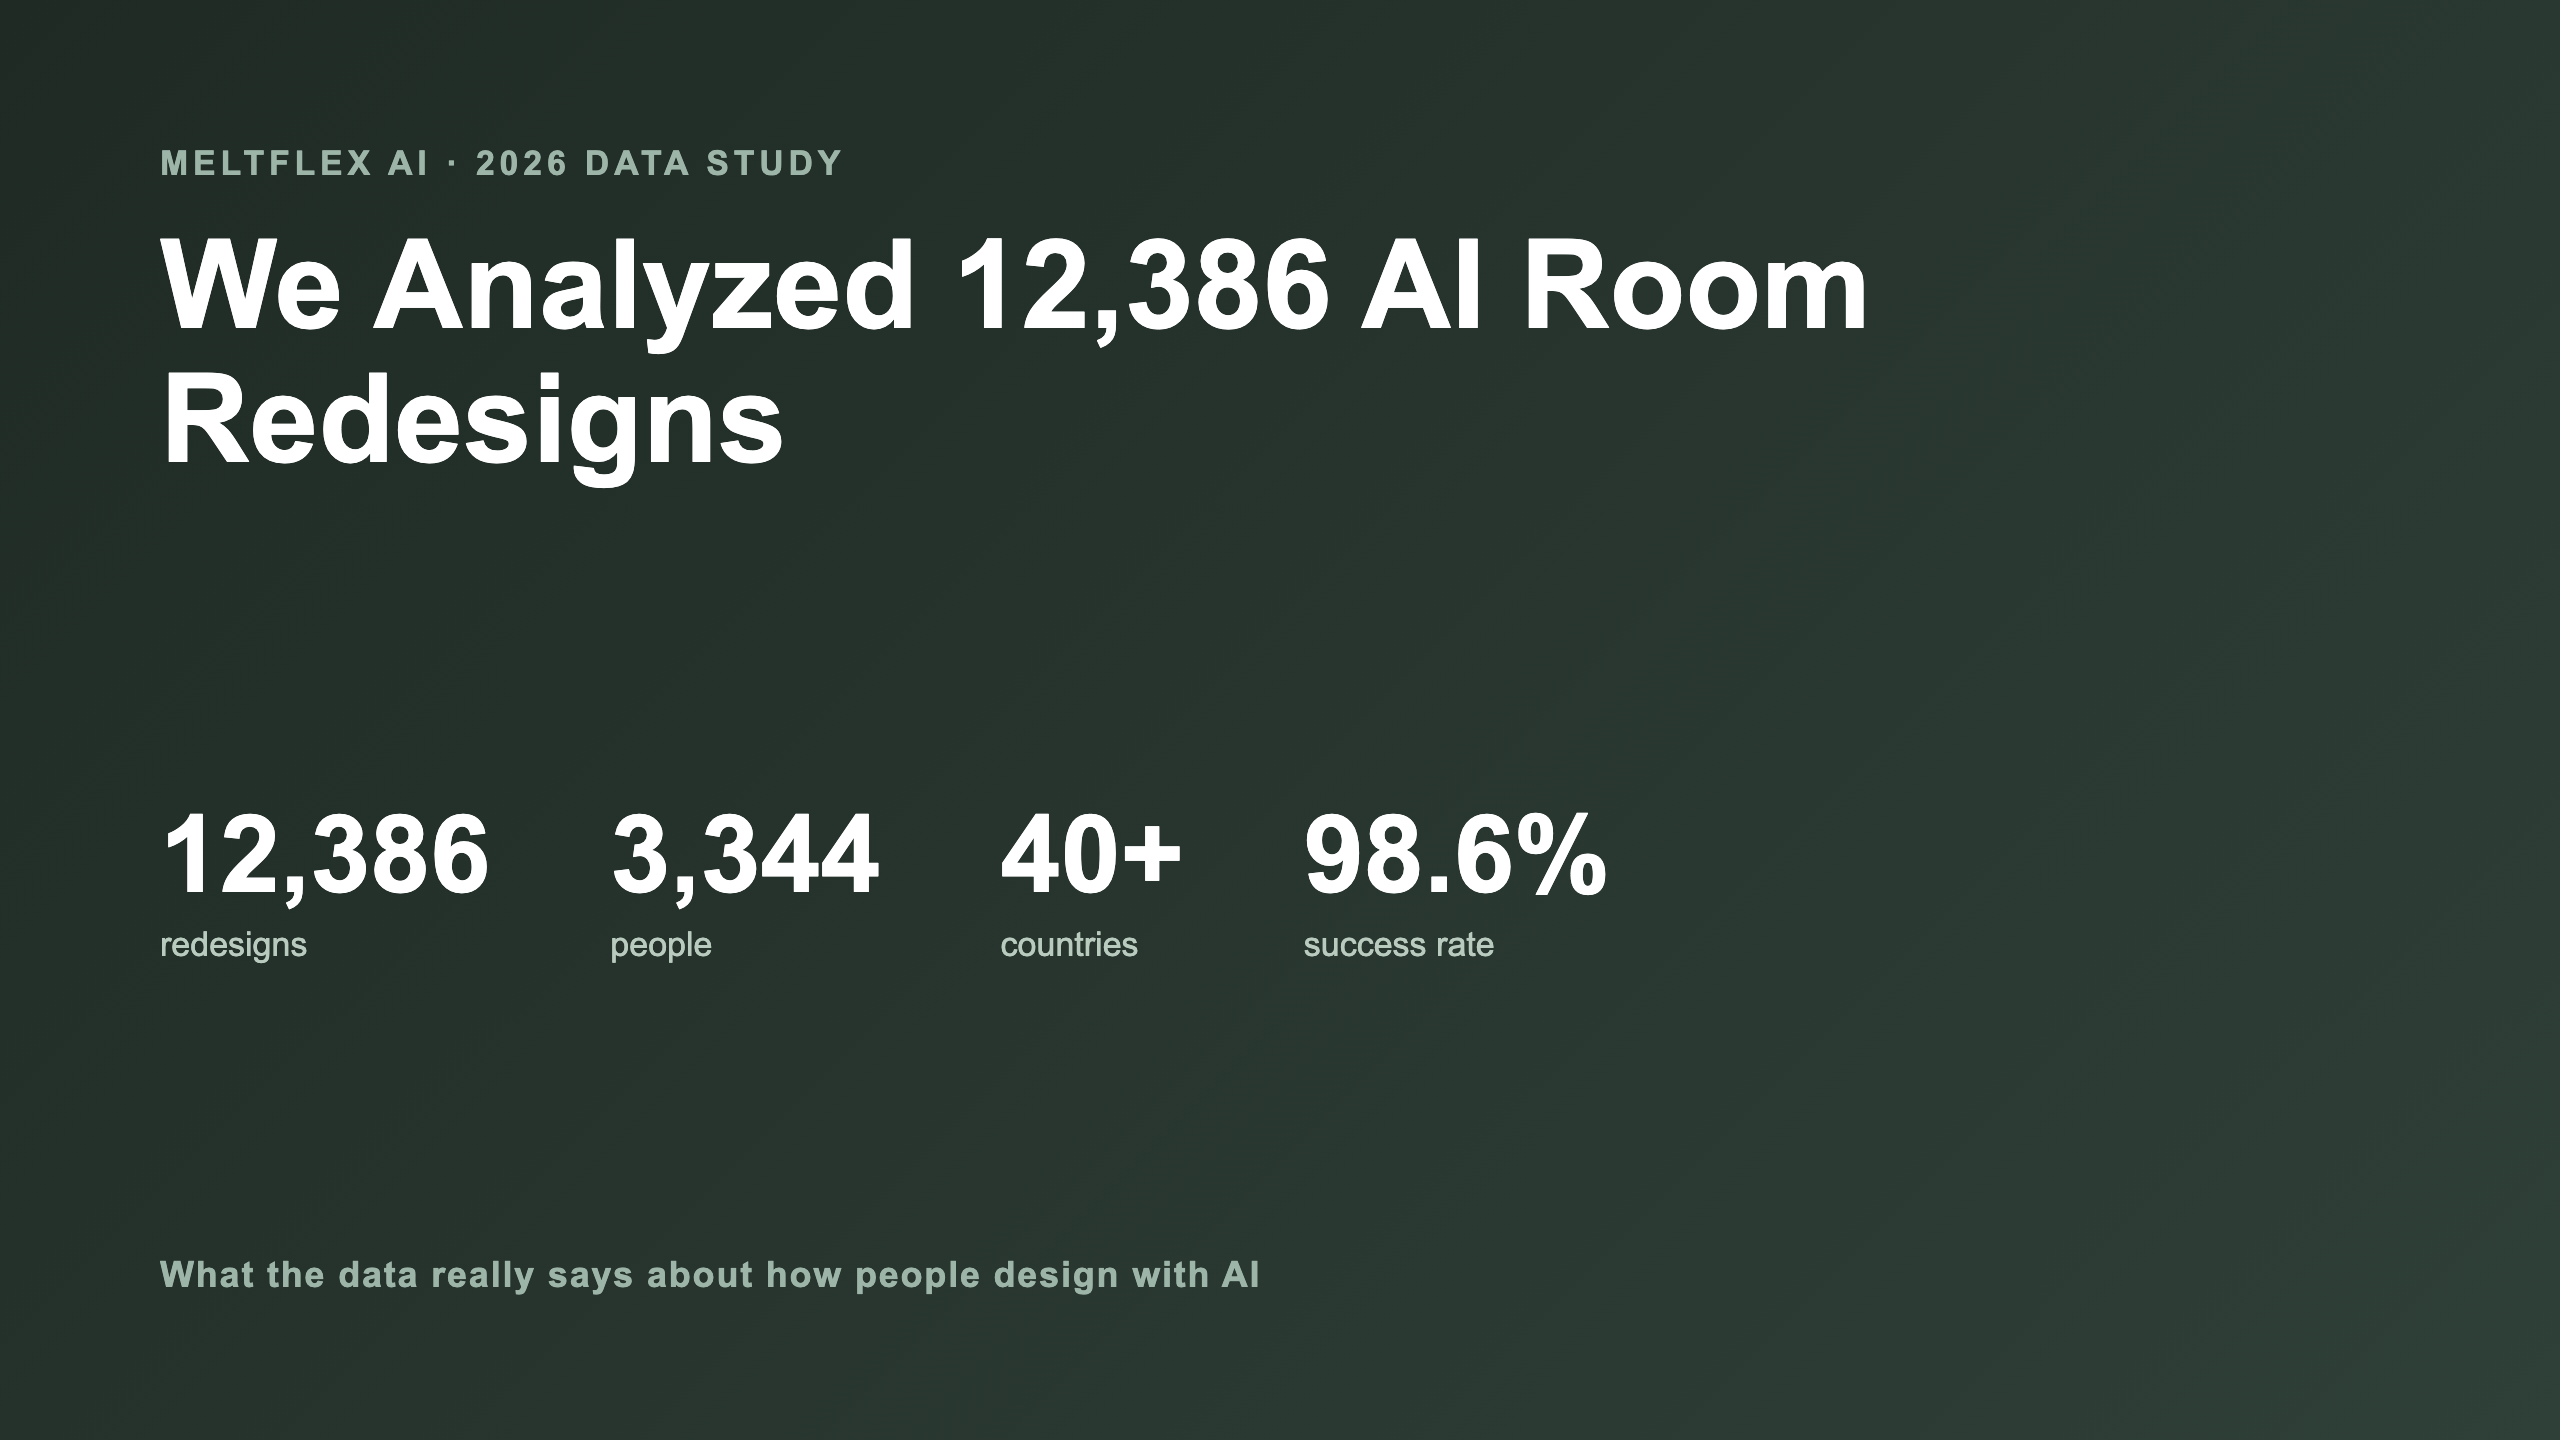
Most articles about AI interior design are opinion. This one is data. We run an AI room redesign tool, MeltFlex, and over a 90 day window we recorded how thousands of real people actually used it: which styles they chose, which rooms they redesigned, where and when they did it, and how often it worked. This is what 12,386 AI room redesigns from 3,344 people reveal about how people are really using AI to design their homes in 2026.
We have tried to be straight about the limits of this data, and there is a full limitations section near the end that you should read before quoting any single number. But the headline patterns are clear, sometimes surprising, and useful whether you are a homeowner, a designer, or just curious where this technology is heading.
Key findings at a glance
- Minimalist and Scandinavian dominate. Together they made up about 83 percent of style choices.
- The living room is king. It was the most redesigned room at roughly 46 percent, ahead of dining rooms and bedrooms.
- People design on desktop, not mobile. About 86 percent of redesigns were created on a computer.
- Redesigning is a daytime, weekday habit. Activity peaks in the morning and midday, dips overnight, and Thursday is the busiest day.
- Most people make exactly one redesign. The mean is 3.7, but the median is 1, with a small power-user tail doing the rest.
- It is already global and reliable. Redesigns came from 40-plus countries, and under 1.5 percent of attempts failed.
Watch: one of the 12,386 redesigns in action
Every data point in this study started the same way: a photo in, a redesign out. Here is that exact process, MeltFlex redesigning a real room from a single upload in seconds, the raw material behind all 12,386 redesigns below.
A single AI room redesign, the process behind all 12,386 in this study.
Methodology
The data covers a 90 day window in spring 2026 and comes from anonymised, aggregated product analytics on MeltFlex, not from any single user. The redesign, device, and timing figures are based on 10,104 redesign sessions and 12,386 finished redesigns from 3,344 people. The style and room figures come from the selections people made at the start of the flow: 1,673 style selections and 1,845 room selections. No personal data is used or shown anywhere in this study, and every chart below is generated directly from these counts.
Finding 1: A small, devoted group does most of the designing
In 90 days, 3,344 people produced 12,386 finished redesigns, which averages out to about 3.7 per person. But the average lies, and this is where most write-ups would stop and mislead you. The shape of the data tells a more honest story.
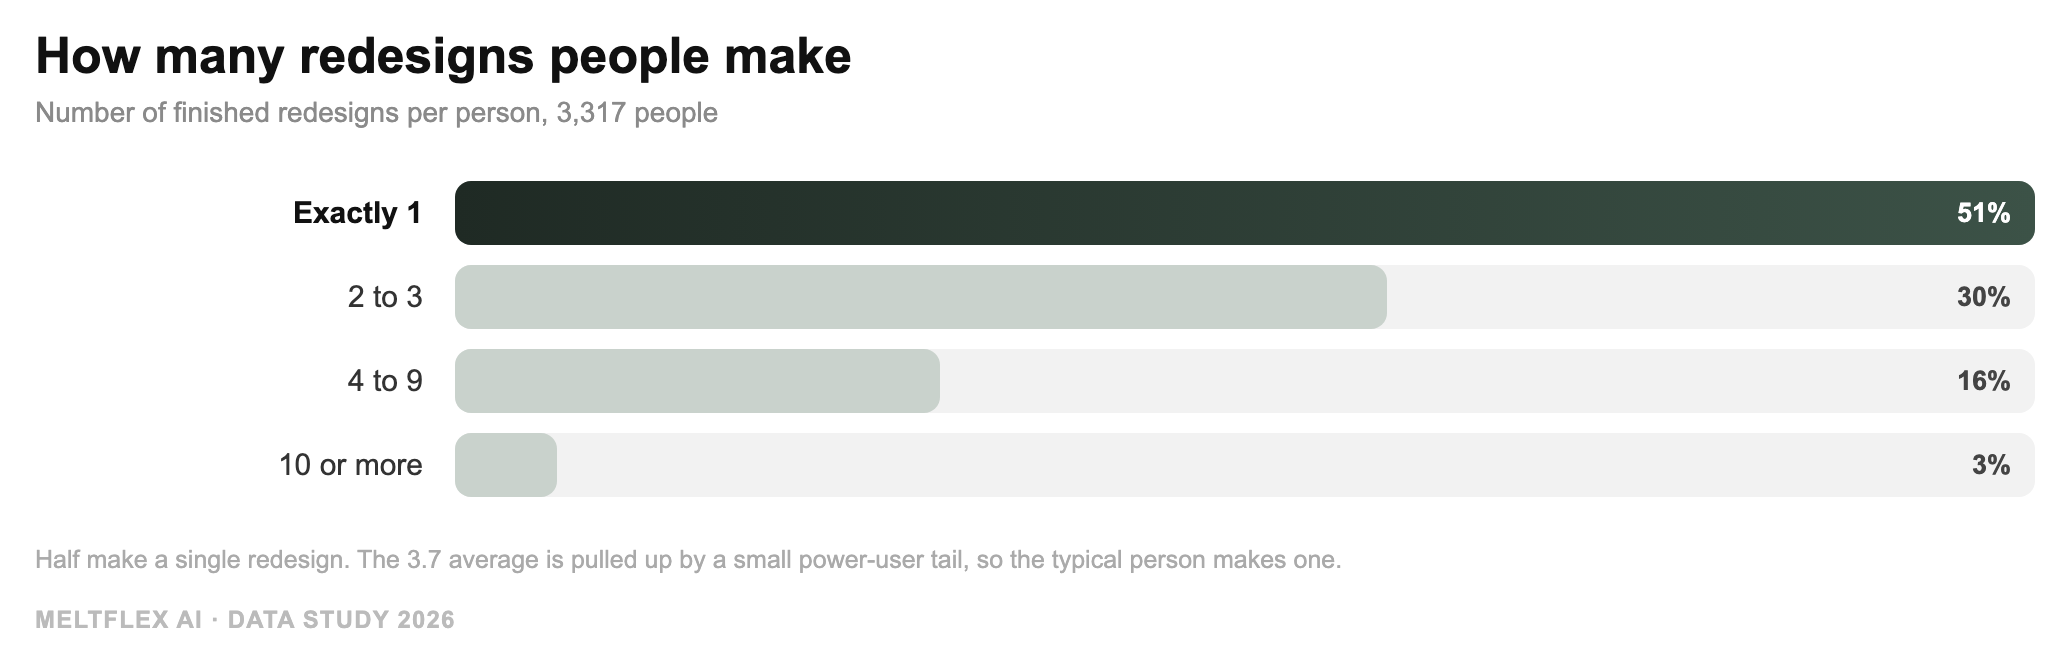
The typical person makes a single redesign. A small power-user tail making ten or more is what pulls the 3.7 average up.
So the truthful version is this: roughly half of people make exactly one redesign and leave, while a devoted minority returns again and again. The mean of 3.7 is real, but the median is 1. If you are building or buying an AI design tool, that split matters more than the headline average: most visitors want one good answer fast, and a smaller group wants to explore deeply.
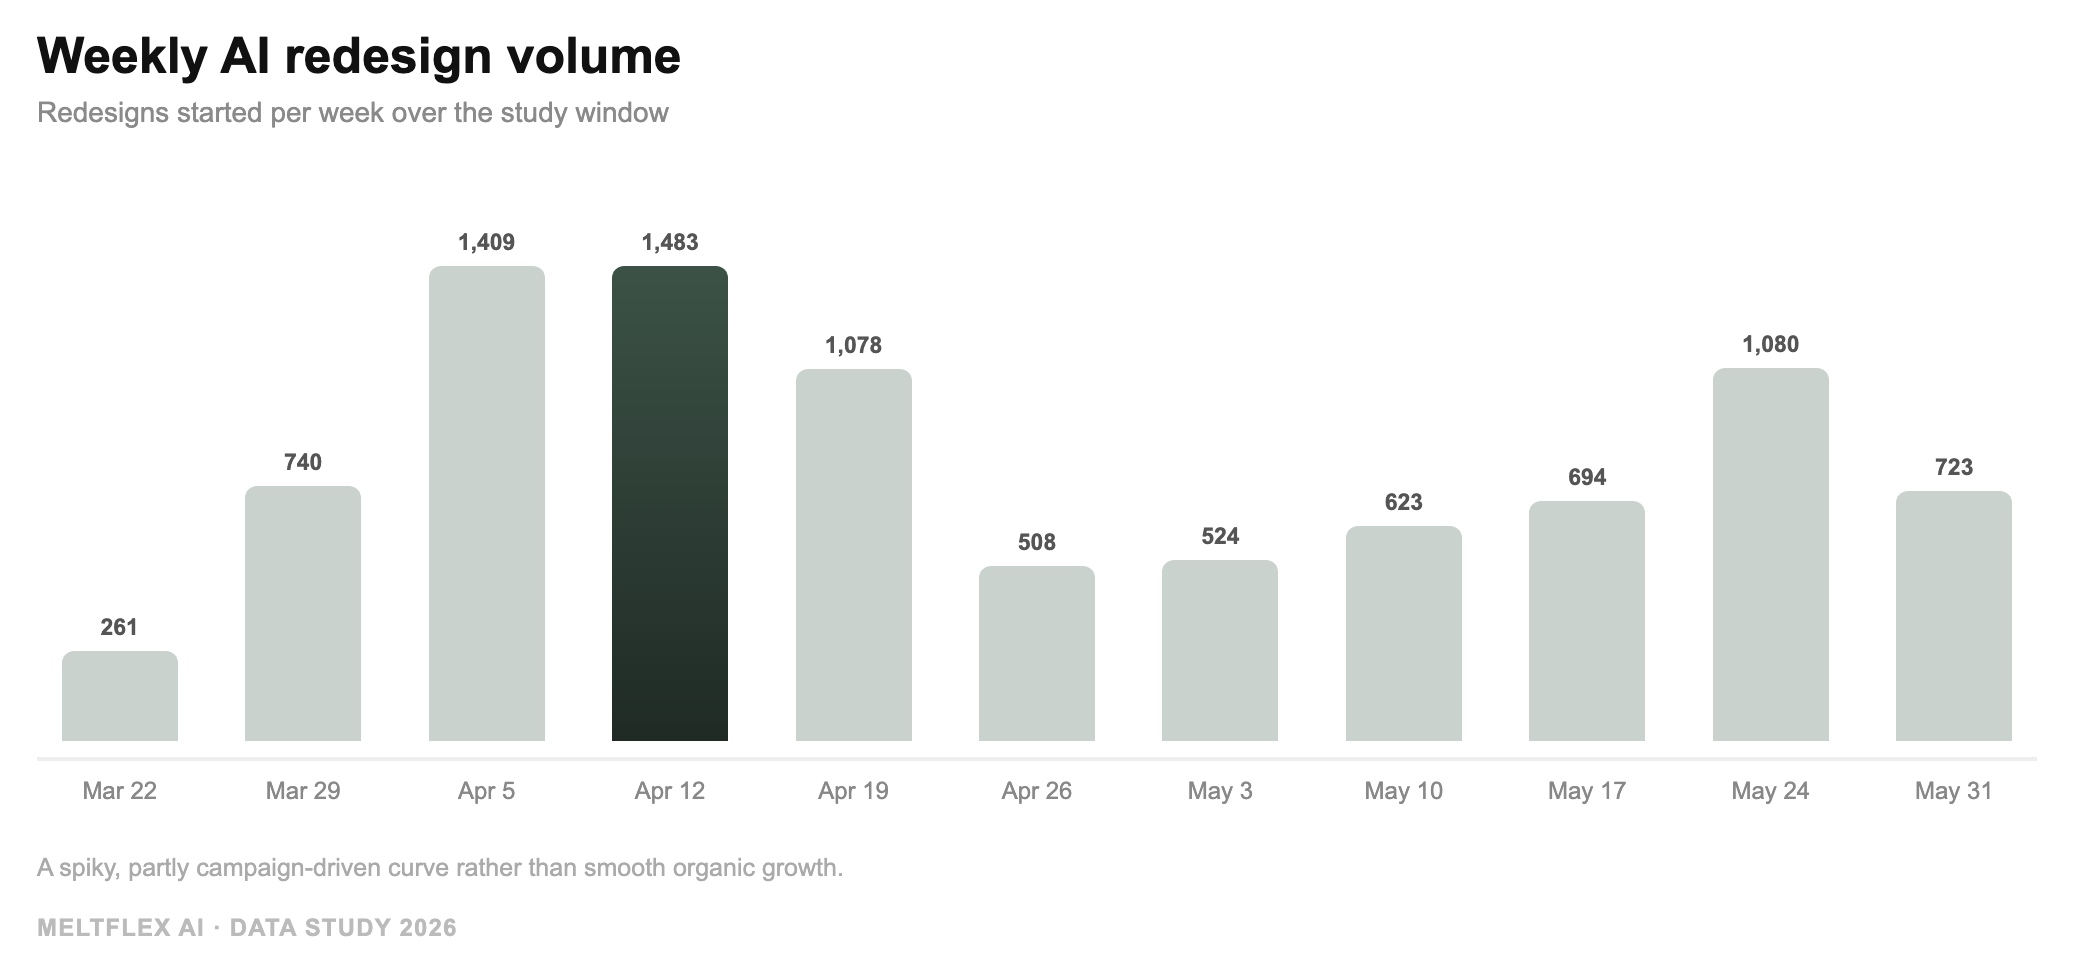
Weekly volume is spiky rather than smoothly growing, which tells you something honest about the traffic (more on that in the limitations).
Finding 2: This is already a global habit
AI interior design is not a Silicon Valley curiosity. Redesigns in this window came from more than 40 countries, spread across every populated continent. The United States, Belgium, Canada, India, New Zealand and the United Kingdom all show up strongly. Slovakia tops the list mainly because MeltFlex is a Slovak company, so treat that one as a home-market artifact rather than a signal about the country.
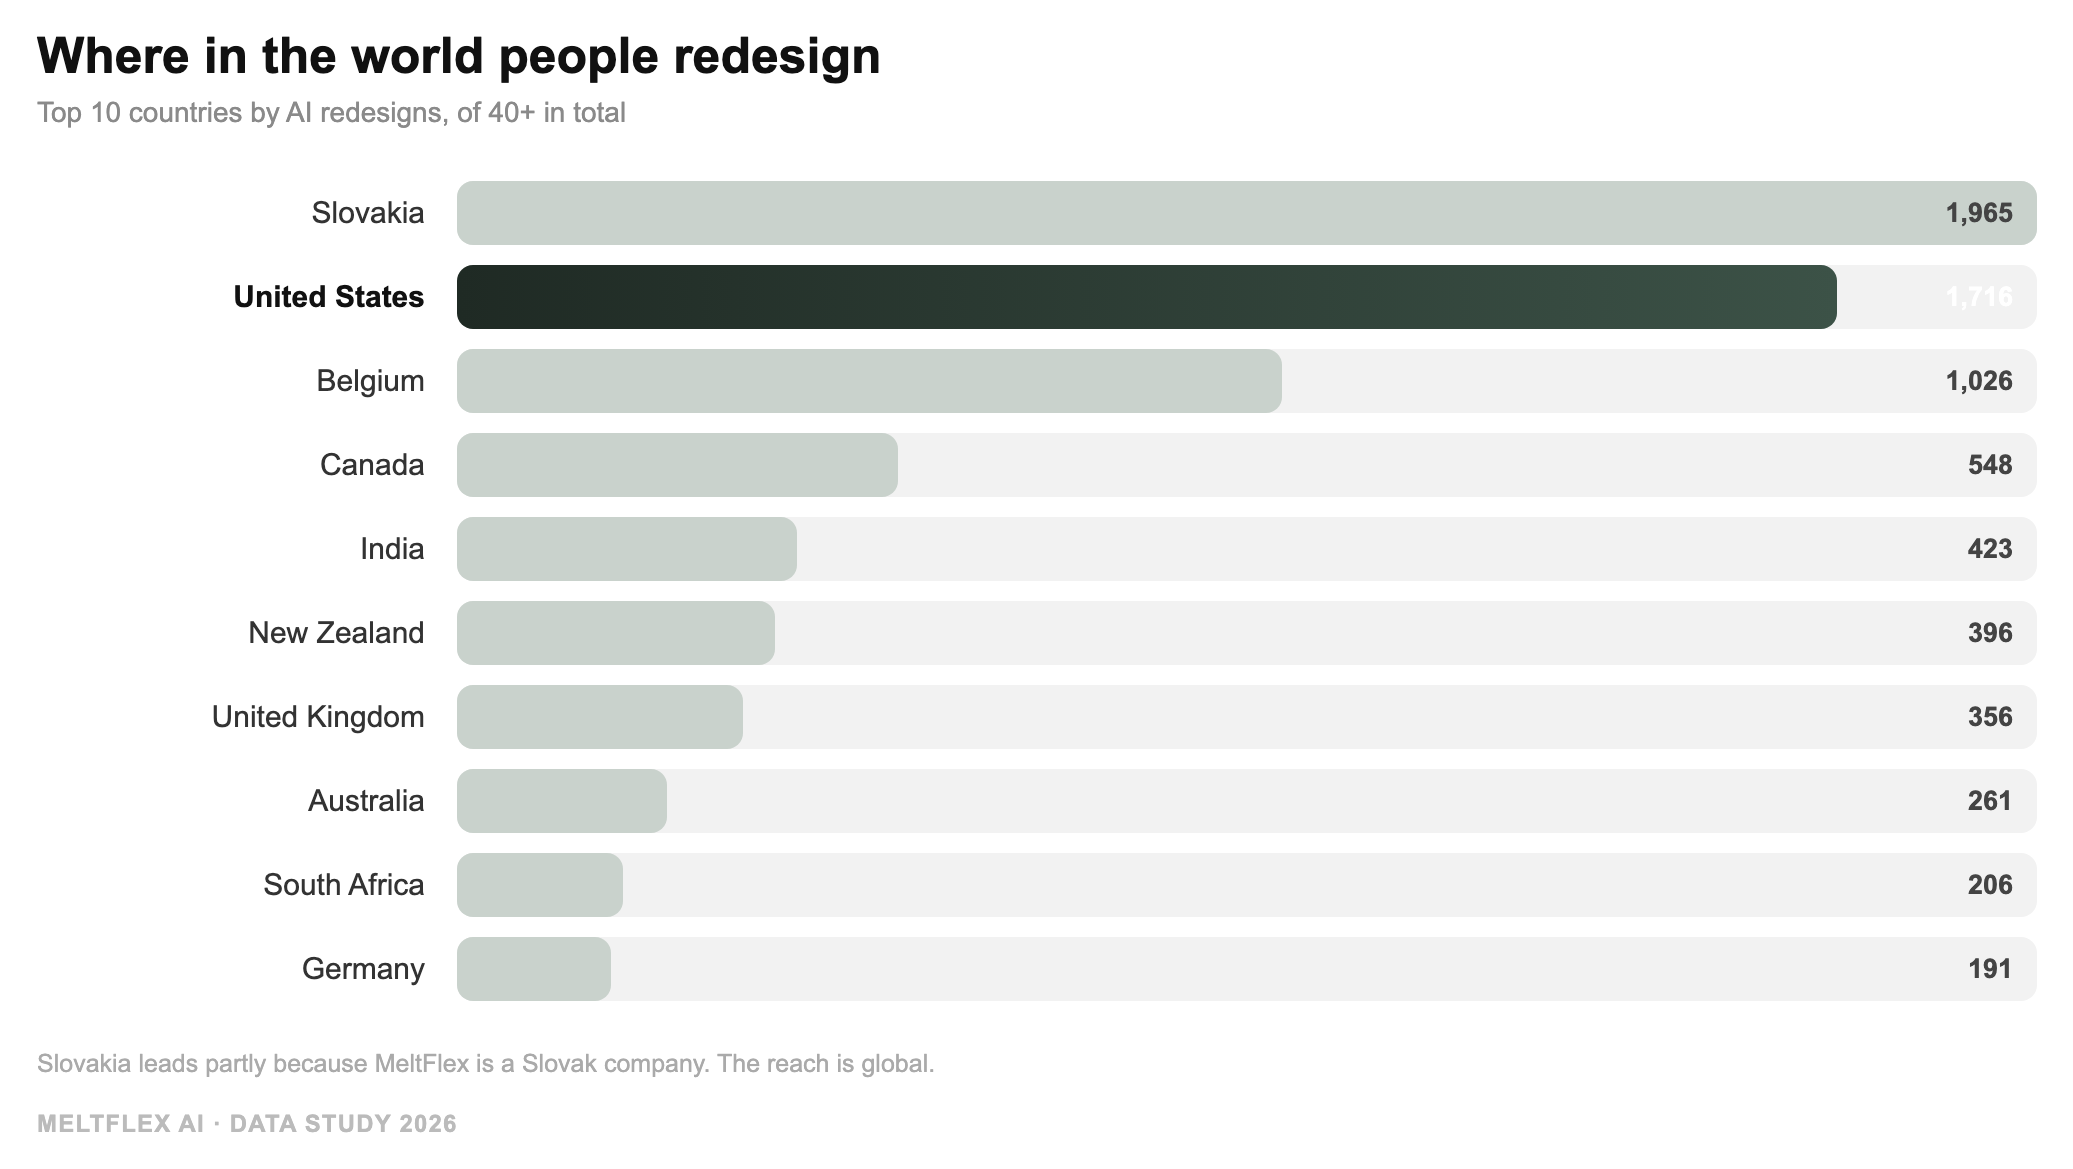
Top 10 of 40-plus countries. The interesting part is the spread, not the order: this behaviour is genuinely worldwide.
Finding 3: Calm, pared back styles win
When people pick a direction, they reach for restraint. Across 1,673 style selections, minimalist took roughly 50 percent and Scandinavian about 33 percent. Modern trailed at 12 percent and industrial at just 5 percent. In other words, four out of five people chose one of the two quietest, most neutral looks on offer.
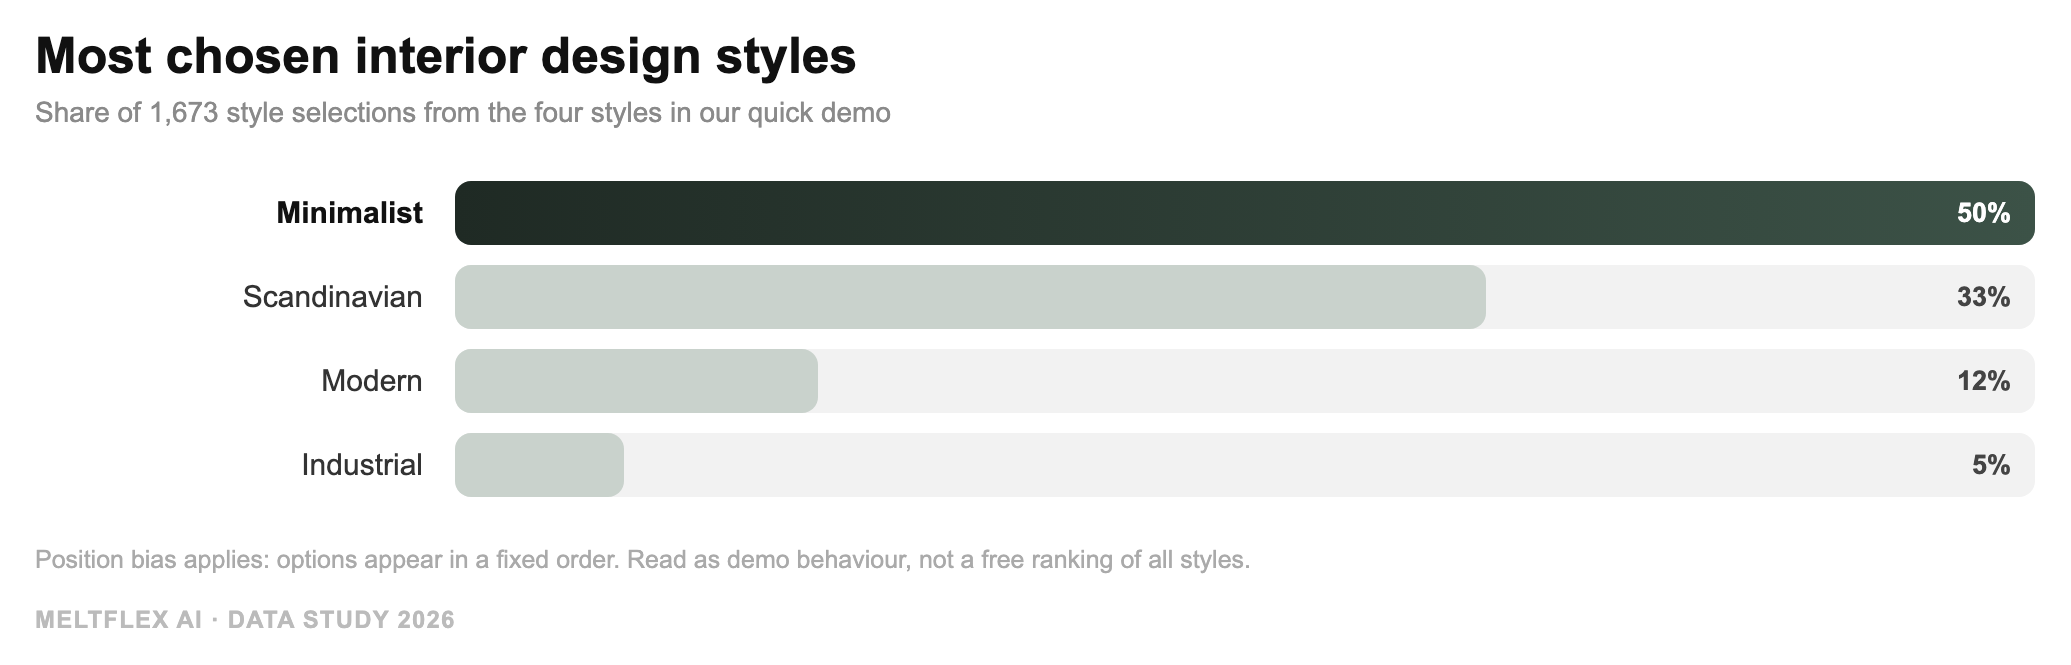
Minimalist and Scandinavian dominate. Read the caveat in the chart: these are choices from a fixed set of demo options, not a free ranking of all styles.
This is the finding to be most careful with, and we say so on the chart itself. These selections come from a quick demo that presents four styles in a fixed order, so position bias inflates the top option and the long tail of styles people might actually love is simply not on the menu. The safe takeaway is not that nobody likes maximalism. It is that when people are eased into AI design with simple options, they gravitate to calm and neutral first.
Finding 4: The living room is where the work happens
Rooms told a cleaner story. Out of 1,845 room selections, the living room led at about 46 percent, the dining room followed at roughly 30 percent, and the bedroom came in around 25 percent.
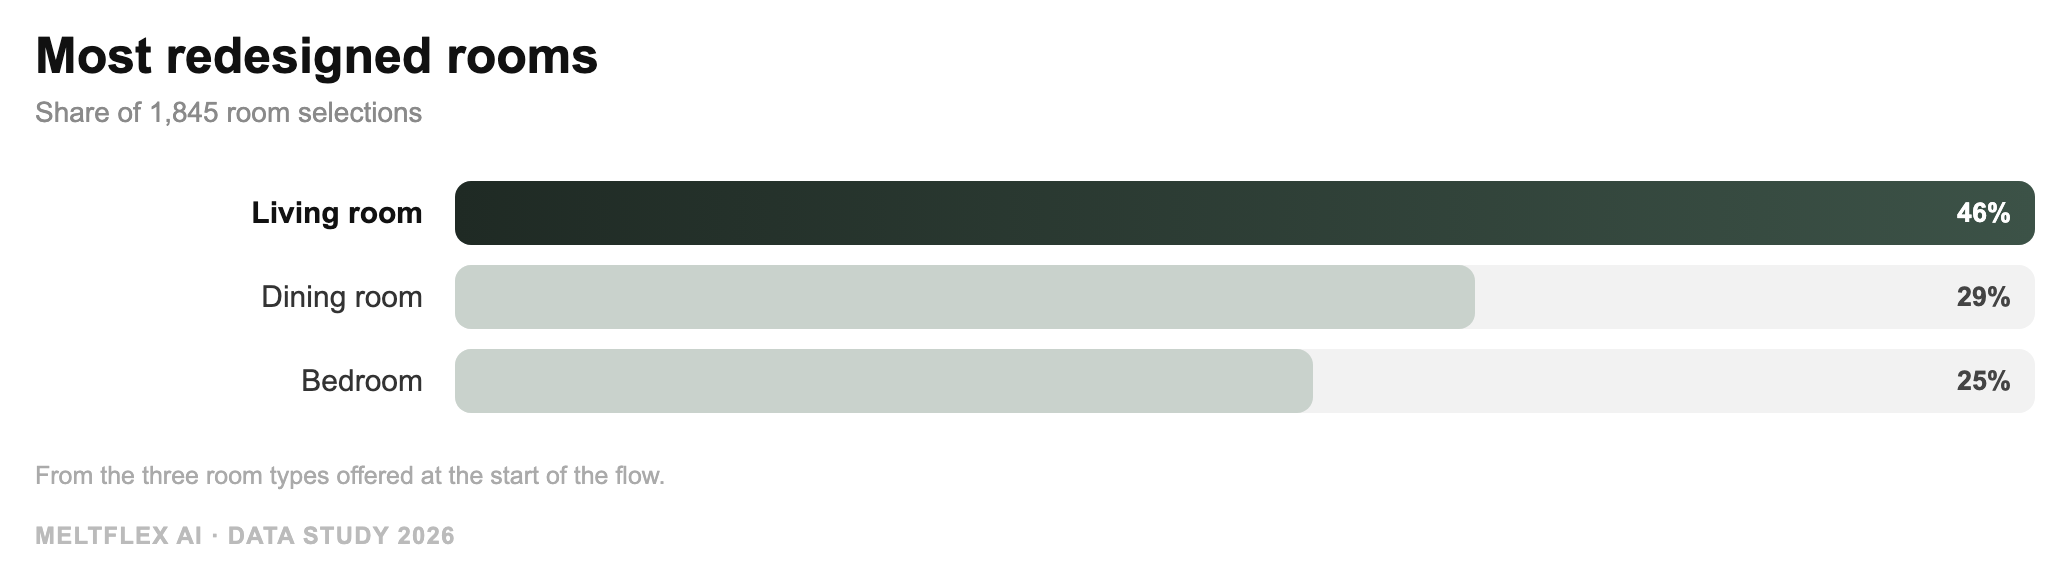
The living room is the most redesigned space, which lines up with it being the room people show off and the one with the most furniture decisions.
The living room leading is intuitive. It is the most public room in a home, it carries the most furniture, and a restyle there has the biggest visible payoff. If you are deciding where to point an AI tool first, the crowd is telling you to start here.
Finding 5: People design on a computer, even though they do not have to
This was the most counterintuitive result. The tool works perfectly on a phone, yet across 10,104 redesigns, about 86 percent were made on desktop, only 13 percent on mobile, and under 1 percent on tablet.
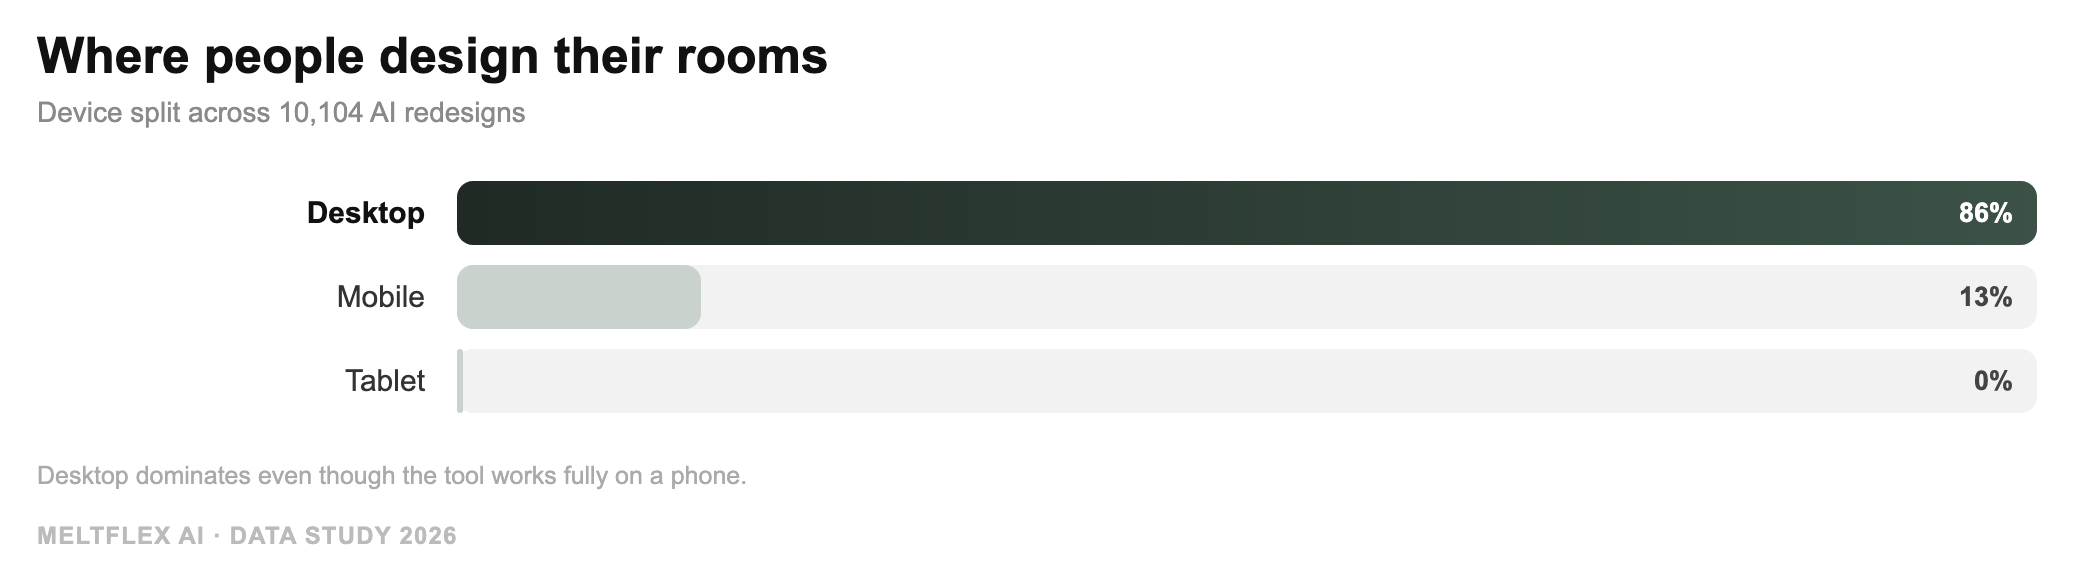
Desktop dominates by a wide margin, suggesting room redesign is a considered, sit-down task rather than a quick phone action.
The lesson here is about intent, not screens. Redesigning a room is a considered decision. People sit down at a computer, often with shopping tabs open alongside, and treat it like a project. That has a real product implication: the most valuable AI design features are the ones that support comparing, planning, and buying, not just generating one quick image on the go.
Finding 6: Redesigning is a daytime, weekday habit
Activity is not spread evenly through the day. Redesigns climb through the morning, peak around the start of the working day and again at midday, then taper into the evening and fall off overnight.
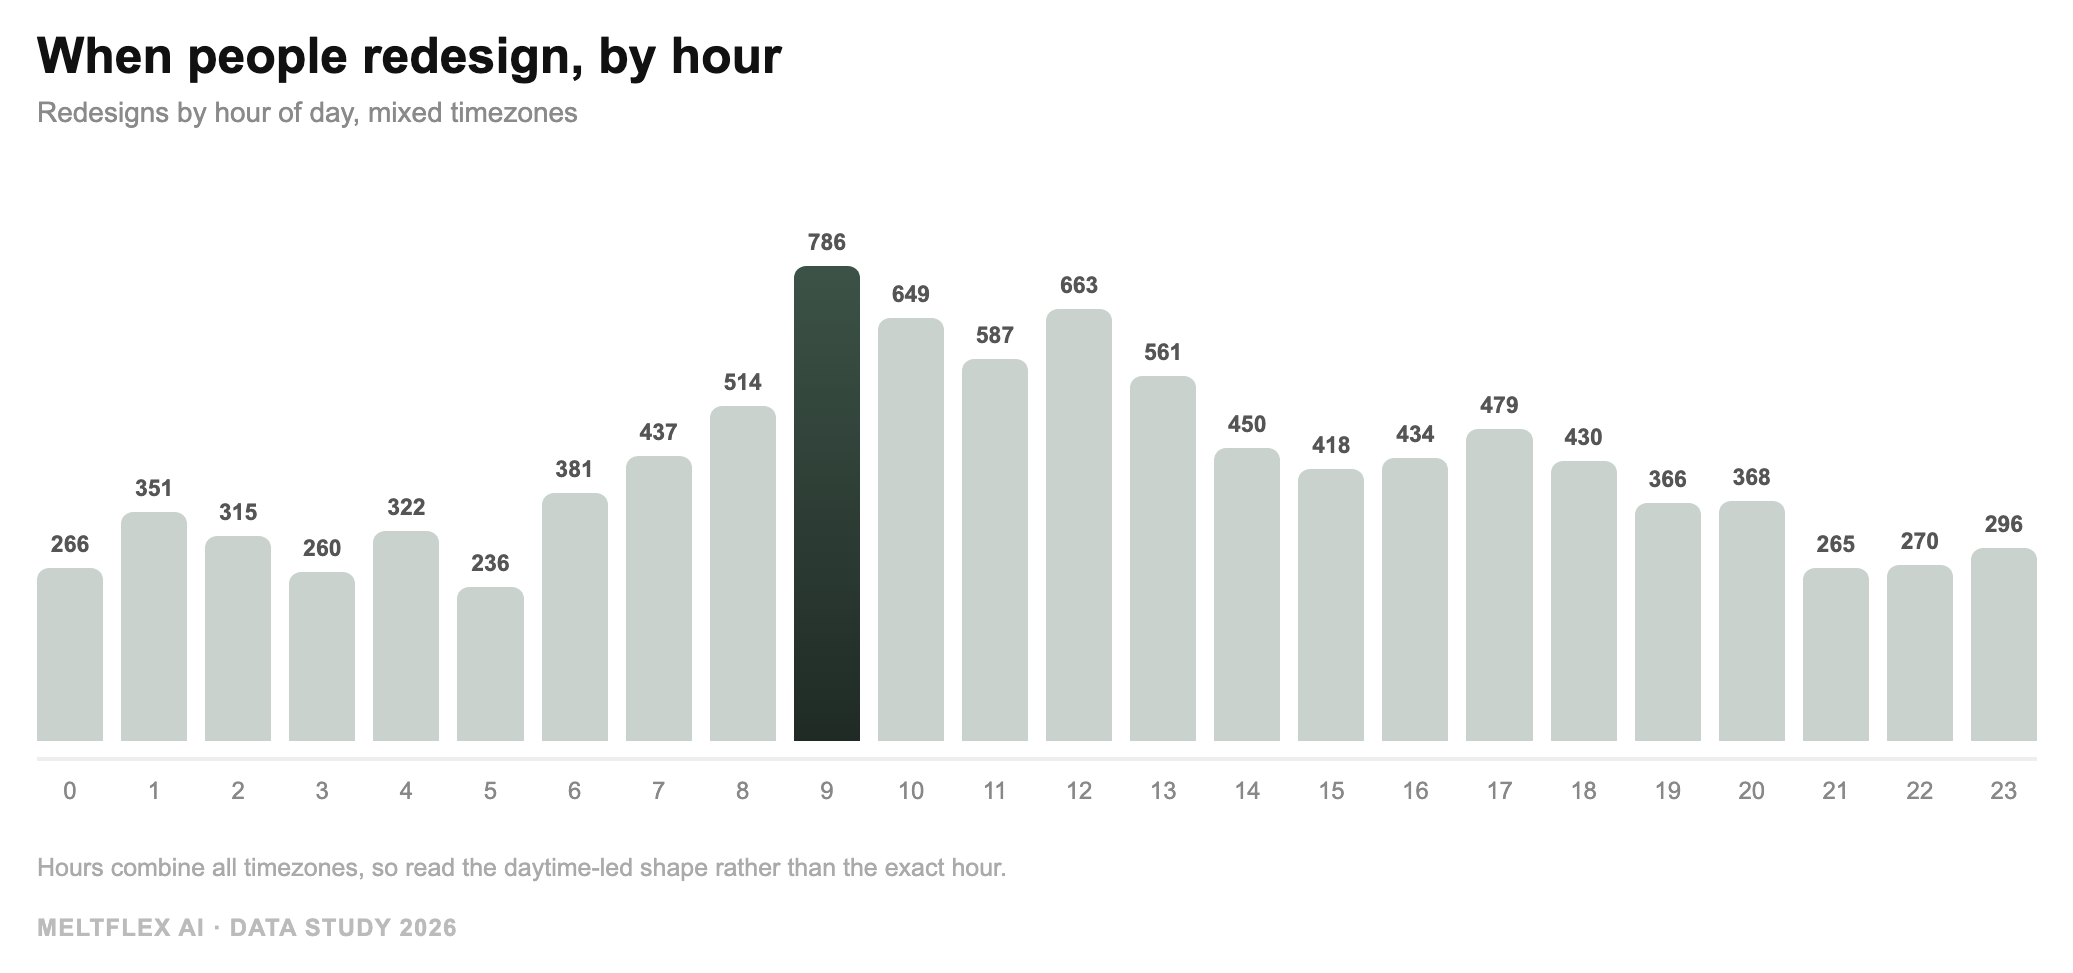
Hours are mixed across timezones, so read the shape rather than the exact hour. The pattern is clearly daytime led.
The weekly rhythm says the same thing. Thursday was the busiest day and Saturday the quietest, which quietly reinforces the desktop finding: this looks more like something people do during structured, at-the-desk time than a weekend lean-back activity.

Mid-week peaks, a weekend dip. Redesigning a room is behaving like a weekday planning task, not a weekend hobby.
Finding 7: The technology mostly just works
For all the talk of AI being unpredictable, the failure rate was low. Fewer than 1.5 percent of redesign attempts failed to return an image, so more than 98 percent completed. The unsolved problem in AI interior design in 2026 is not whether you get a render. It is whether the render is realistic and actionable, which is far more about the photo you feed it, and whether the tool keeps your real room and links to furniture you can buy, than about the model failing.
What this means for 2026
- For homeowners: you are normal if you generate several versions. The average person makes about four. Start with your living room, shoot it in daylight, and expect to iterate.
- For designers: clients are arriving pre-loaded with calm, minimalist and Scandinavian references. AI is shaping the brief before you ever meet them, which is a starting point to work with, not against.
- For the industry: the desktop and iteration data say people treat AI design as planning, not entertainment. The tools that win will be the ones that help people decide and buy, not just admire.
Limitations, in plain terms
A study is only as honest as its caveats, so here are ours, unvarnished:
- It is one product’s users, not the public. Everyone here chose to use MeltFlex, mostly after searching for or clicking an ad about AI interior design. That is an audience already sold on the idea, not a representative sample of homeowners.
- The style and room numbers come from a constrained menu. They reflect picks from a small, fixed, ordered set of options in a quick demo, so position bias and limited choice shape the result. Treat them as demo behaviour, not a universal ranking of styles.
- It is observational. We measured what people did, not what they would do in a controlled test. No causation should be read into any of it.
- The window is short and specific. 90 days in spring 2026, with traffic that is partly campaign driven, which is why the weekly chart is spiky rather than smooth.
- Hours mix timezones. The timing chart shows server time across a global audience, so the shape is meaningful but the exact peak hour is not.
None of this erases the findings. It frames them. The patterns that survive these caveats, that people iterate, that the living room leads, and that this is a desktop, daytime, planning activity, are the ones worth trusting.
Cite this study
You are welcome to reference these figures. If you do, please credit MeltFlex AI and link back to this page so readers can see the methodology and limitations. Suggested citation: MeltFlex AI, “We Analyzed 12,386 AI Room Redesigns: A 2026 Interior Design Data Study” (2026), www.meltflexai.com. If you want the underlying breakdowns for a story, get in touch.
Keep reading
- I tested 12 AI interior design tools in 2026, the test that actually separates them.
- The best AI interior design tools compared, the wider field side by side.
- AI interior design prompts that actually work, to get better results from any tool.
- How to see furniture in your room before you buy it, the practical version of these findings.
- How to find the interior design style that fits your room, since calm styles led our data.
- Try it yourself, upload a photo of your room and see it redesigned.